Python如何使用bokeh包和geojson數(shù)據(jù)繪制地圖
最近要繪制倫敦區(qū)地圖,查閱了很多資料后最終選擇使用bokeh包以及倫敦區(qū)的geojson數(shù)據(jù)繪制。bokeh是基于python的繪圖工具,可以繪制各種類型的圖表,支持geojson數(shù)據(jù)的讀取及繪制地圖。
安裝bokeh
$ pip install bokeh
軟件版本
python-3.7.7bokeh-2.0.0
數(shù)據(jù)來源
倫敦地圖數(shù)據(jù)來源于Highmaps地圖數(shù)據(jù)集。下載的是英國的地圖數(shù)據(jù)united-kindom.geo.json。需要對得到的數(shù)據(jù)進(jìn)行預(yù)處理才能得到只含倫敦地區(qū)的數(shù)據(jù)。這需要對geojson數(shù)據(jù)的格式有一定的了解。在對數(shù)據(jù)進(jìn)行處理之前,先看如何繪制英國地圖。
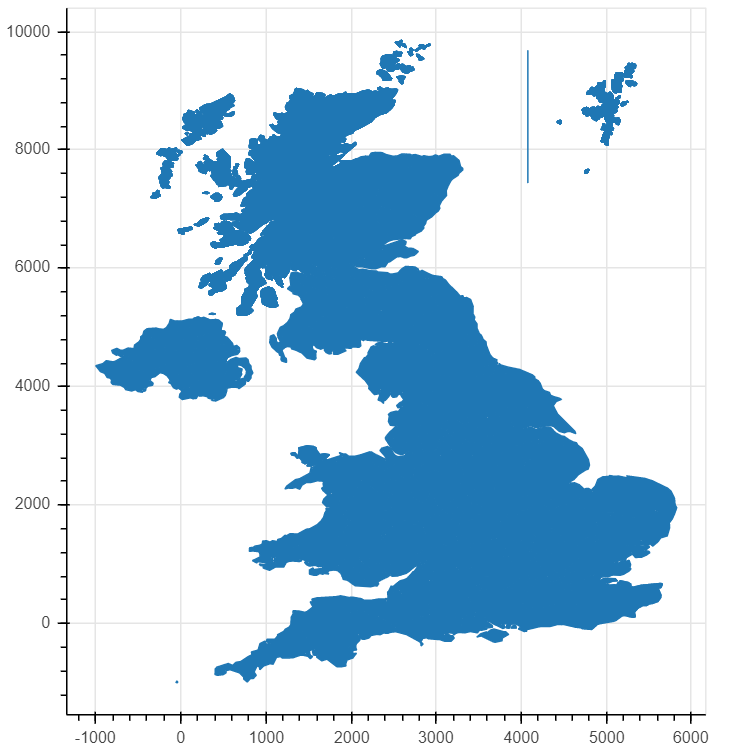
繪制英國地圖
from bokeh.plotting import curdoc, figurefrom bokeh.models import GeoJSONDataSource# 讀入英國地圖數(shù)據(jù)并傳給GeoJSONDataSourcewith open('united-kindom.geo.json', encoding='utf8') as f: geo_source = GeoJSONDataSource(geojson=f.read())# 設(shè)置一張畫布p = figure(width=500, height=500)# 使用patches函數(shù)以及geo_source繪制地圖p.patches(xs=’xs’, ys=’ys’, source=geo_source)curdoc().add_root(p)
上述代碼可以繪制出英國地圖。將上述代碼保存為test.py,在終端運(yùn)行
$ bokeh serve --show test.py
這會自動打開瀏覽器,并顯示英國地圖。運(yùn)行結(jié)果如圖:
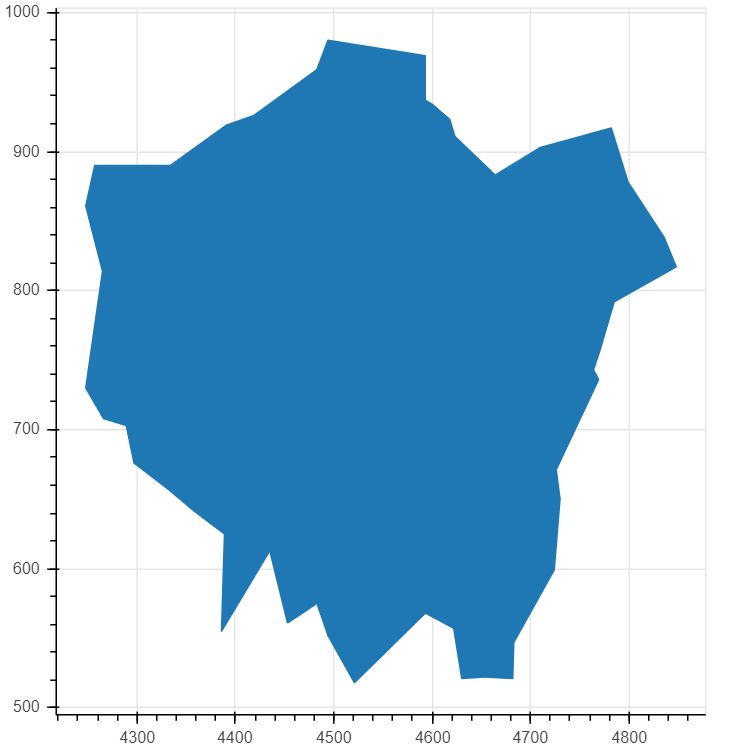
獲取倫敦地區(qū)數(shù)據(jù)
獲取倫敦地區(qū)數(shù)據(jù)可以手動從united-kingdom.geo.json文件中篩選出倫敦的數(shù)據(jù),也可以先用python先把數(shù)據(jù)過濾一遍,然后將數(shù)據(jù)傳給bokeh。這需要對geojson文件格式有一定的了解,在此不詳細(xì)介紹。
from bokeh.plotting import curdoc, figurefrom bokeh.models import GeoJSONDataSourceimport json# 用json庫讀取數(shù)據(jù)with open('united-kindom.geo.json', encoding='utf8') as f: data = json.loads(f.read())# 判斷是不是倫敦地區(qū)數(shù)據(jù)def isInLondon(district): if ’type’ in district[’properties’] and ’london borough’ in district[’properties’][’type’].lower(): return True if ’type-en’ in district[’properties’] and ’london borough’ in district[’properties’][’type’].lower(): return True if ’woe-name’ in district[’properties’] and ’city of london’ in district[’properties’][’woe-name’].lower(): return True return False# 過濾數(shù)據(jù)data[’features’] = list(filter(isInLondon, data[’features’]))#geo_source = GeoJSONDataSource(geojson=json.dumps(data))p = figure(width=500, height=500)p.patches(xs=’xs’, ys=’ys’, source=geo_source)curdoc().add_root(p)
運(yùn)行結(jié)果如圖:
美化
上面的倫敦地圖只是一個大概的輪廓,下面對地圖添加一系列功能。
添加各區(qū)輪廓線
p.patches(xs=’xs’, ys=’ys’, fill_alpha=0.7, # 畫輪廓線 line_color=’white’, # 線的顏色 line_width=0.5, # 線的寬度 source=geo_source)
現(xiàn)在地圖區(qū)域輪廓很清晰。
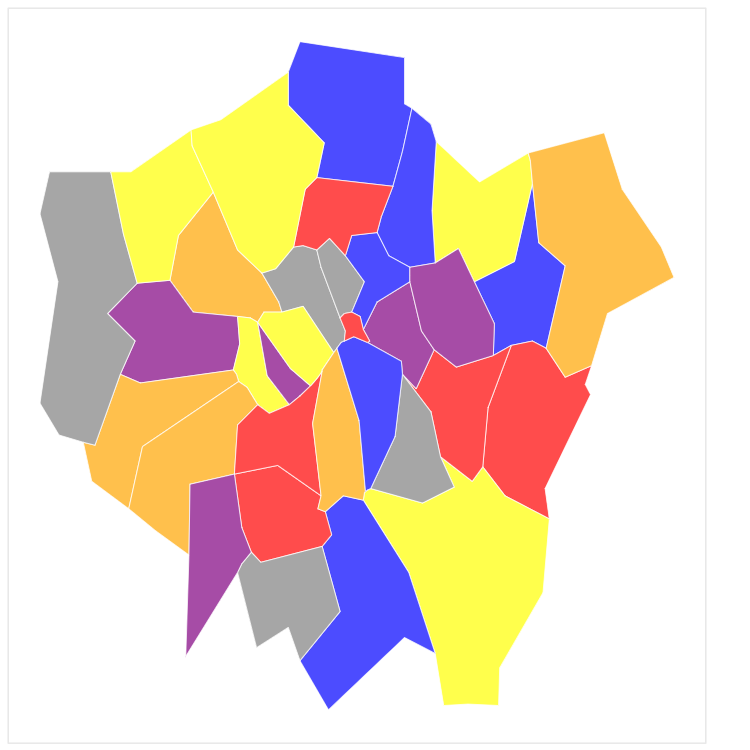
添加顏色
# 為每一個地區(qū)增加一個color屬性for i in range(len(data[’features’])): data[’features’][i][’properties’][’color’] = [’blue’, ’red’, ’yellow’, ’orange’, ’gray’, ’purple’][i % 6]p.patches(xs=’xs’, ys=’ys’, fill_alpha=0.7, line_color=’white’, line_width=0.5, color='color', # 增加顏色屬性,這里的'color'對應(yīng)每個地區(qū)的color屬性 source=geo_source)
現(xiàn)在地圖五顏六色。
增加圖注
import random# 隨機(jī)產(chǎn)生數(shù)據(jù)用于展示for i in range(len(data[’features’])): data[’features’][i][’properties’][’number’] = random.randint(0, 20_000)p = figure(width=500, height=500, tooltips='@name, number: @number' # 使用tooltips生成圖注,@+屬性名稱,這里的name是數(shù)據(jù)中原本有的,number是新近添加的。 )
現(xiàn)在鼠標(biāo)放到區(qū)域上時,會顯示'區(qū)域名, number: 數(shù)字'。
去掉坐標(biāo)軸與背景線
p.axis.axis_label = Nonep.axis.visible = Falsep.grid.grid_line_color = None
最終代碼
from bokeh.plotting import curdoc, figurefrom bokeh.models import GeoJSONDataSourceimport jsonimport randomwith open('united-kindom.geo.json', encoding='utf8') as f: data = json.loads(f.read())def isInLondon(district): if ’type’ in district[’properties’] and ’london borough’ in district[’properties’][’type’].lower(): return True if ’type-en’ in district[’properties’] and ’london borough’ in district[’properties’][’type’].lower(): return True if ’woe-name’ in district[’properties’] and ’city of london’ in district[’properties’][’woe-name’].lower(): return True return Falsedata[’features’] = list(filter(isInLondon, data[’features’]))for i in range(len(data[’features’])): data[’features’][i][’properties’][’color’] = [’blue’, ’red’, ’yellow’, ’orange’, ’gray’, ’purple’][i % 6] data[’features’][i][’properties’][’number’] = random.randint(0, 20_000)geo_source = GeoJSONDataSource(geojson=json.dumps(data))p = figure(width=500, height=500, tooltips='@name, number: @number')p.patches(xs=’xs’, ys=’ys’, fill_alpha=0.7, line_color=’white’, line_width=0.5, color='color', source=geo_source)p.axis.axis_label = Nonep.axis.visible = Falsep.grid.grid_line_color = Nonecurdoc().add_root(p)
倫敦地圖完成了
總結(jié)
最開始想用pyecharts做的,但是pyecharts并沒有倫敦的地圖。折騰半天,最后只好自己找geojson數(shù)據(jù)來畫地圖。
找到了很多關(guān)于地圖的數(shù)據(jù)和工具,比如上文中提到的highmap數(shù)據(jù)集,以及DataV.altas,這個工具可以可視化地提取中國區(qū)域的地圖數(shù)據(jù),但感覺比起自己找數(shù)據(jù),畫中國地圖還是pyecharts來得實在。
數(shù)據(jù)最重要。
以上就是本文的全部內(nèi)容,希望對大家的學(xué)習(xí)有所幫助,也希望大家多多支持好吧啦網(wǎng)。
相關(guān)文章:
1. xml創(chuàng)建節(jié)點(diǎn)(根節(jié)點(diǎn)、子節(jié)點(diǎn))2. ASP.NET MVC使用jQuery ui的progressbar實現(xiàn)進(jìn)度條3. 如何使用CSS3畫出一個叮當(dāng)貓4. javascript xml xsl取值及數(shù)據(jù)修改第1/2頁5. ASP基礎(chǔ)入門第一篇(ASP技術(shù)簡介)6. 使用PHP抓取微博數(shù)據(jù)實現(xiàn)demo及原理解析7. 基于Python 的語音重采樣函數(shù)解析8. python開發(fā)一款翻譯工具9. JSP取得在WEB.XML中定義的參數(shù)10. WML學(xué)習(xí)之五 顯示表單
 網(wǎng)公網(wǎng)安備