Python自動化操作實現(xiàn)圖例繪制
折線圖,柱狀圖,餅圖用于數(shù)據(jù)展示,更直觀的分析數(shù)據(jù)。實現(xiàn)繪制的效果圖如下
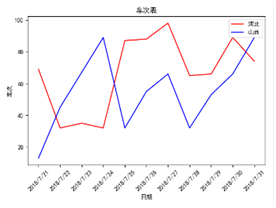
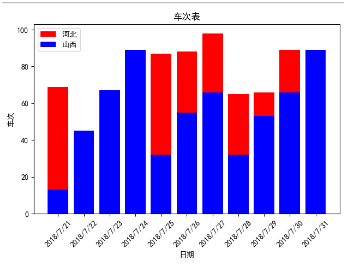
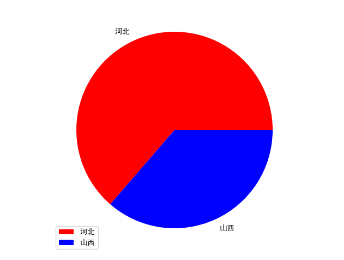
代碼 很簡單,如下
import matplotlib.pyplot as pltplt.rcParams[’font.sans-serif’]=[’SimHei’] #用來正常顯示中文標(biāo)簽#數(shù)據(jù)源date=[’2018/7/21’,’2018/7/22’,’2018/7/23’,’2018/7/24’,’2018/7/25’,’2018/7/26’,’2018/7/27’,’2018/7/28’,’2018/7/29’,’2018/7/30’,’2018/7/31’]hebei= [69,32,35,32,87,88,98,65,66,89,74]shanxi=[13,45,67,89,32,55,66,32,53,66,89]#折線圖plt.plot(date,hebei,color=’red’,label=’河北’)plt.plot(date,shanxi,color=’blue’,label=’山西’)plt.xlabel(’日期’)plt.ylabel(’車次’)plt.title(’車次表’)plt.xticks(rotation=45) #閑轉(zhuǎn)45度plt.legend()plt.show()#柱狀圖plt.bar(date,hebei,color=’red’,label=’河北’)plt.bar(date,shanxi,color=’blue’,label=’山西’)plt.xlabel(’日期’)plt.ylabel(’車次’)plt.title(’車次表’)plt.xticks(rotation=45) #閑轉(zhuǎn)45度plt.legend()plt.show()#餅圖number=[777,444]province=[’河北’,’山西’]colors=[’red’,’blue’]plt.pie(x=number,labels=province,colors=colors)plt.legend()plt.show()
以上就是本文的全部內(nèi)容,希望對大家的學(xué)習(xí)有所幫助,也希望大家多多支持好吧啦網(wǎng)。
相關(guān)文章:
1. 基于javaweb+jsp實現(xiàn)學(xué)生宿舍管理系統(tǒng)2. 如何封裝一個Ajax函數(shù)3. 多級聯(lián)動下拉選擇框,動態(tài)獲取下一級4. ASP.NET MVC實現(xiàn)樹形導(dǎo)航菜單5. 什么是JWT超詳細(xì)講解6. python 在mysql中插入null空值的操作7. Python爬蟲基礎(chǔ)之初次使用scrapy爬蟲實例8. .NET Core中RabbitMQ使用死信隊列的實現(xiàn)9. Python如何telnet到網(wǎng)絡(luò)設(shè)備10. 關(guān)于html嵌入xml數(shù)據(jù)島如何穿過樹形結(jié)構(gòu)關(guān)系的問題

 網(wǎng)公網(wǎng)安備